JSONGrapher
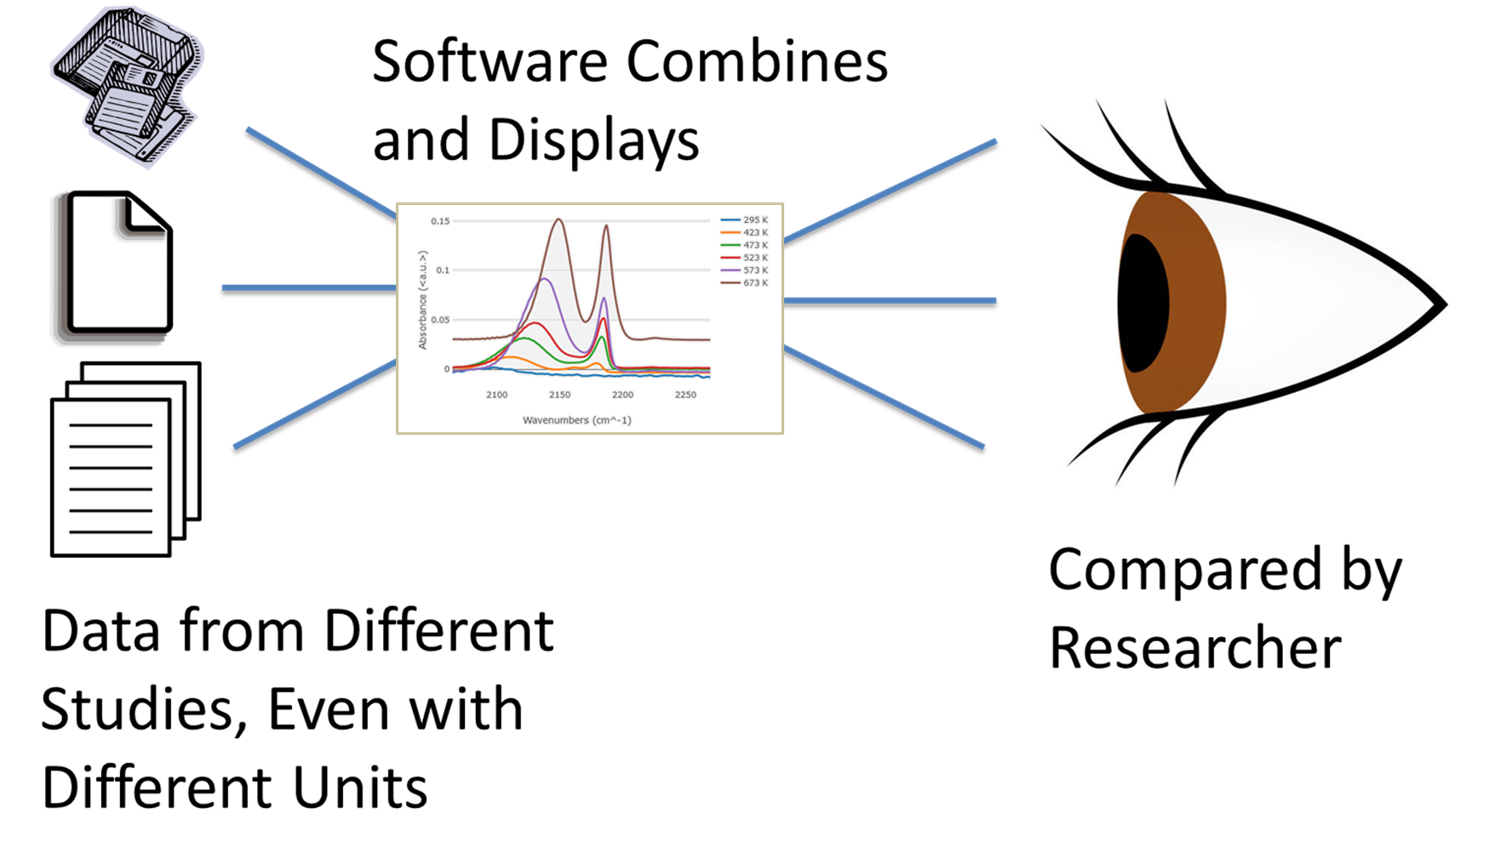
JSONGrapher plots data from one or more files directly in your browser, creating interactive graphs to compare data!
Try plotting one of the example files. Click to download . Just drag-and-drop an example file into the box below, or use the browse-to-upload option. Then, drag in more files to compare additional records on the same graph!
To make your own files, use the python JSONGrapher,
or the browser record creator,
or see the manual.
How to Plot and Features Video | Manual | Advanced Examples (extract from zip to plot)
How to Plot and Features Video | Manual | Advanced Examples (extract from zip to plot)
Drop a file here:
Advanced Examples


